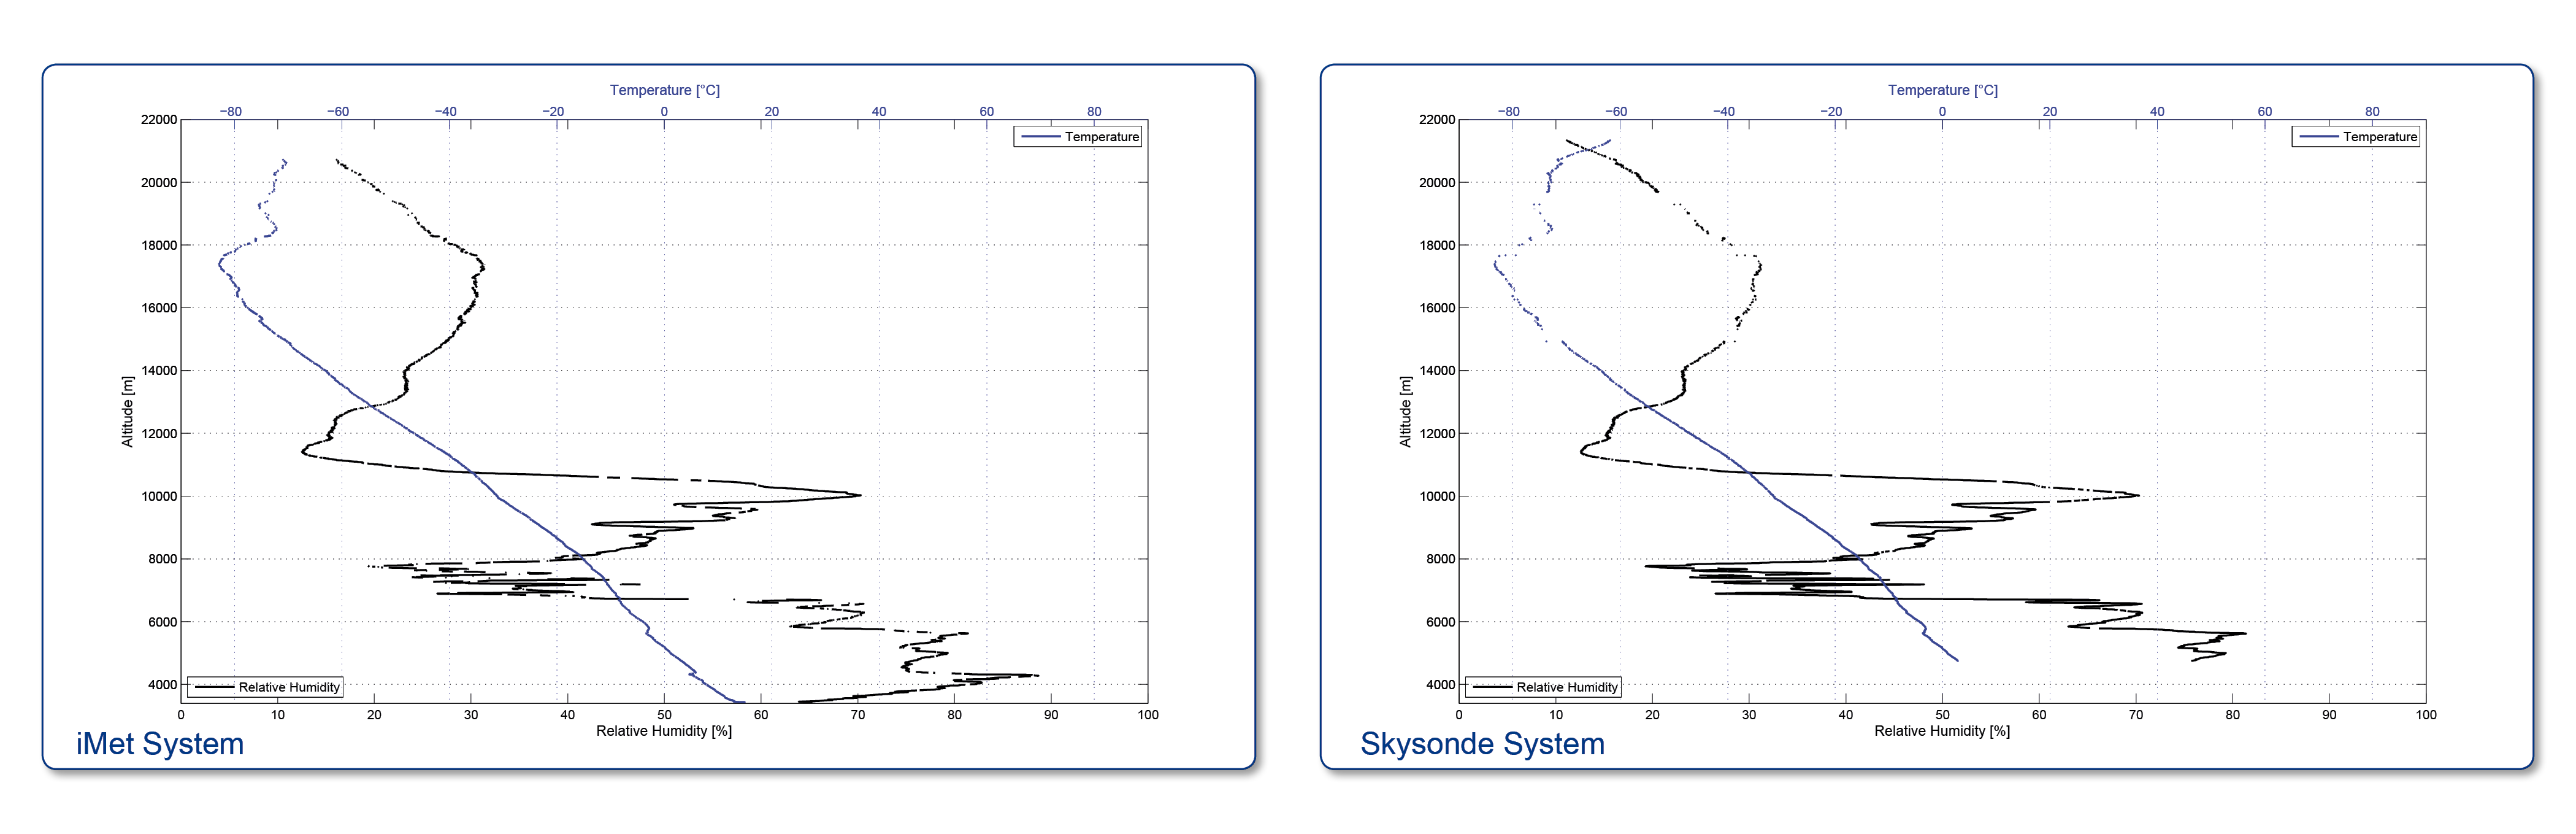
Relative Humidity & Temperature
The RH profile shows several low cloud layers, it also clearly shows a cirrus cloud layer divided in three.
(Click on the figures to enlarge)
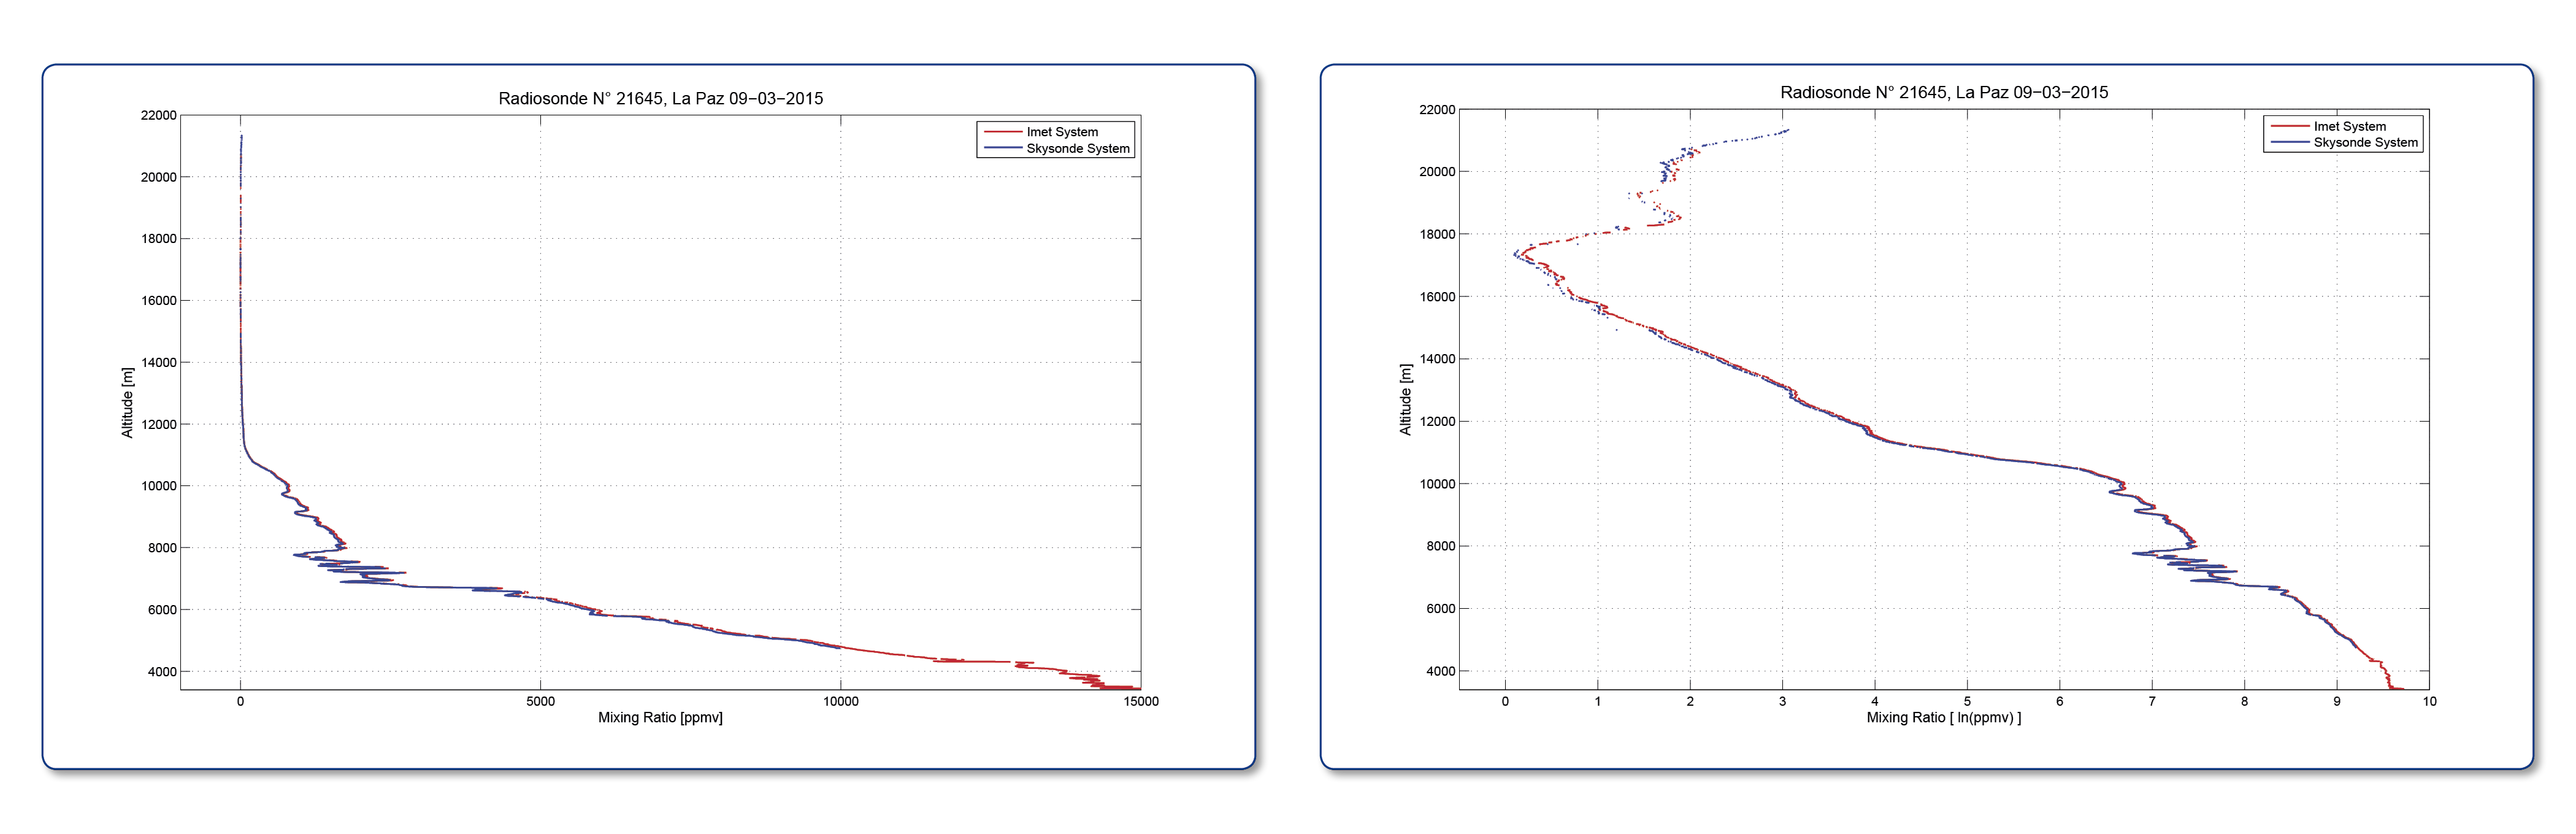
Water Vapor
In mixing ratio profile it can observe the high amount of water vapor contained into low clouds. In contrast to RH profile, the mixing ratio shows the real value of water vapor contained in different cloud layers, This profile reveals that cirrus layer is more dry than low clouds
.
(Click on the figures to enlarge)
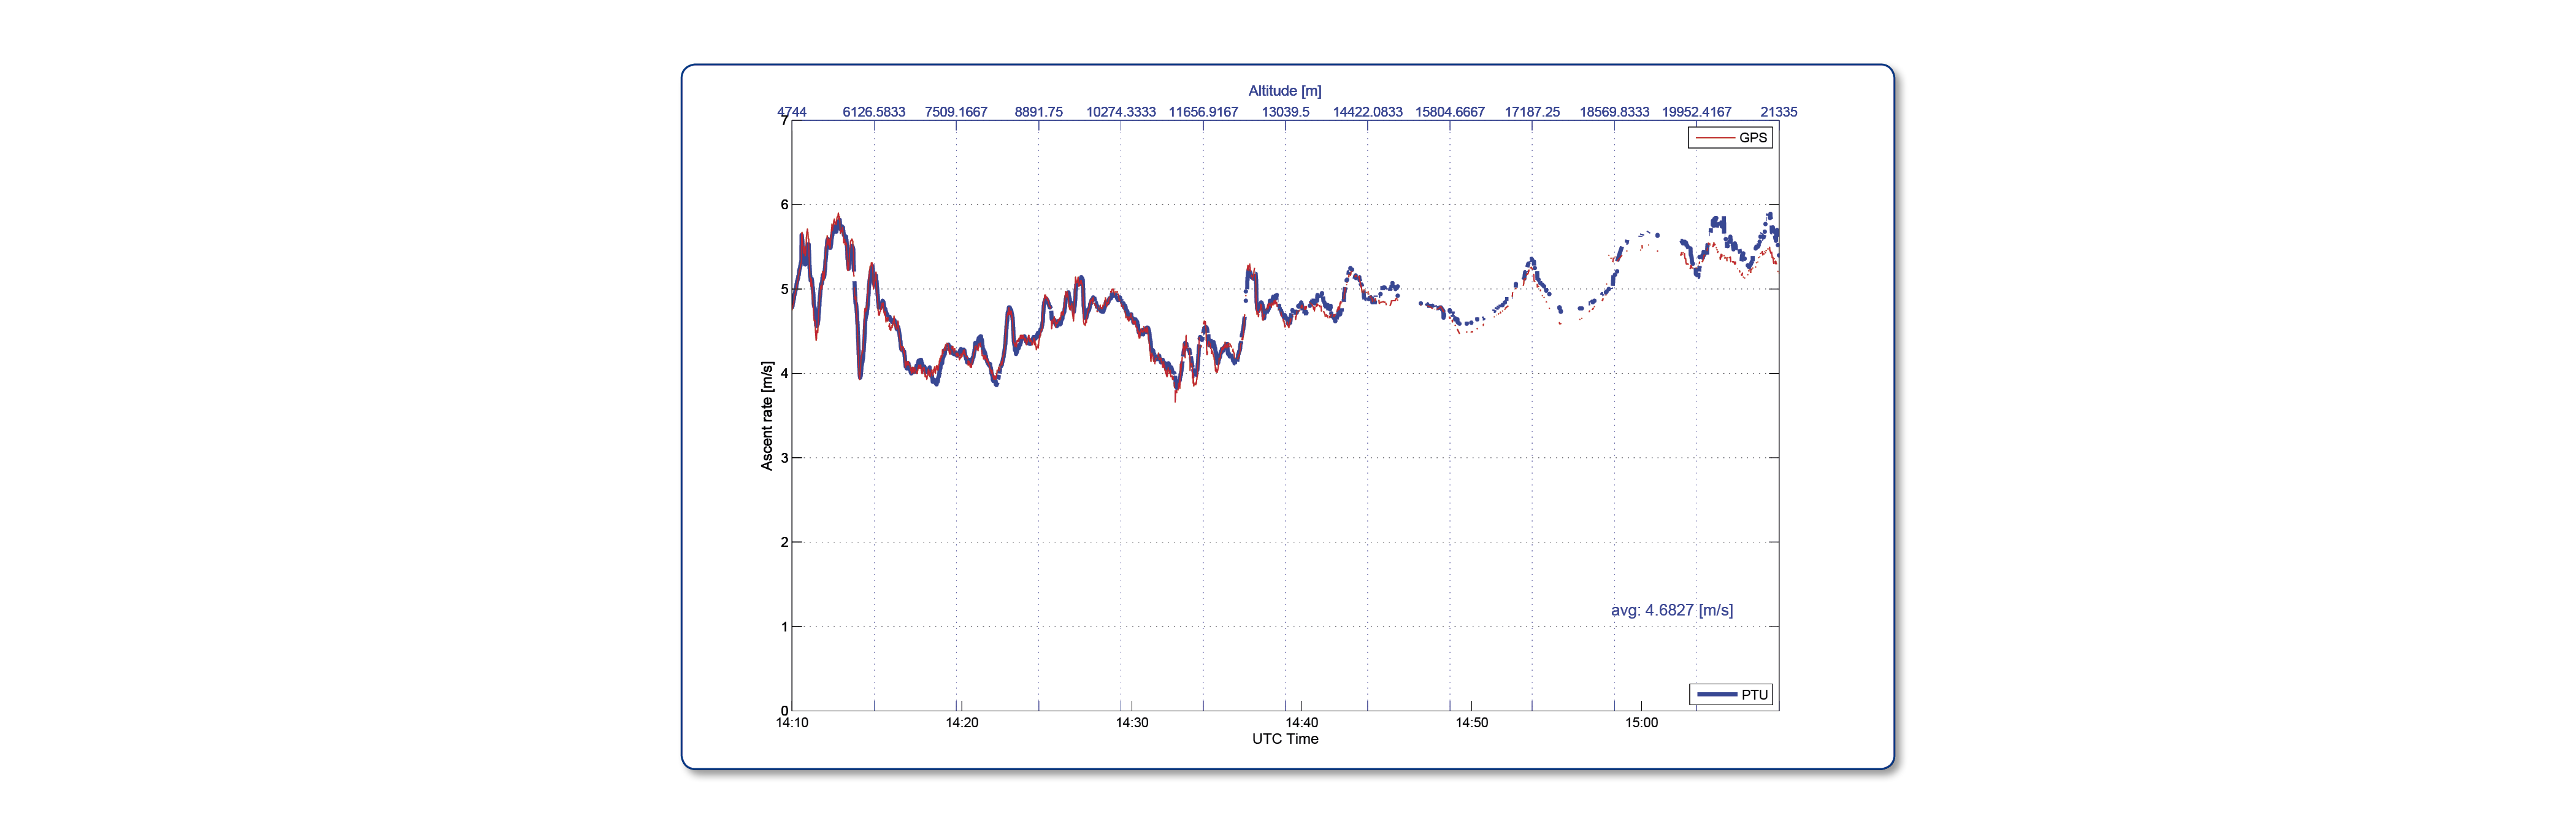
Ascent rate
The ascent rate graph belongs to Skysonde system. It had signal reception issues during the launch, for this, the system acquired data from 4700 masl
.
(Click on the figure to enlarge)
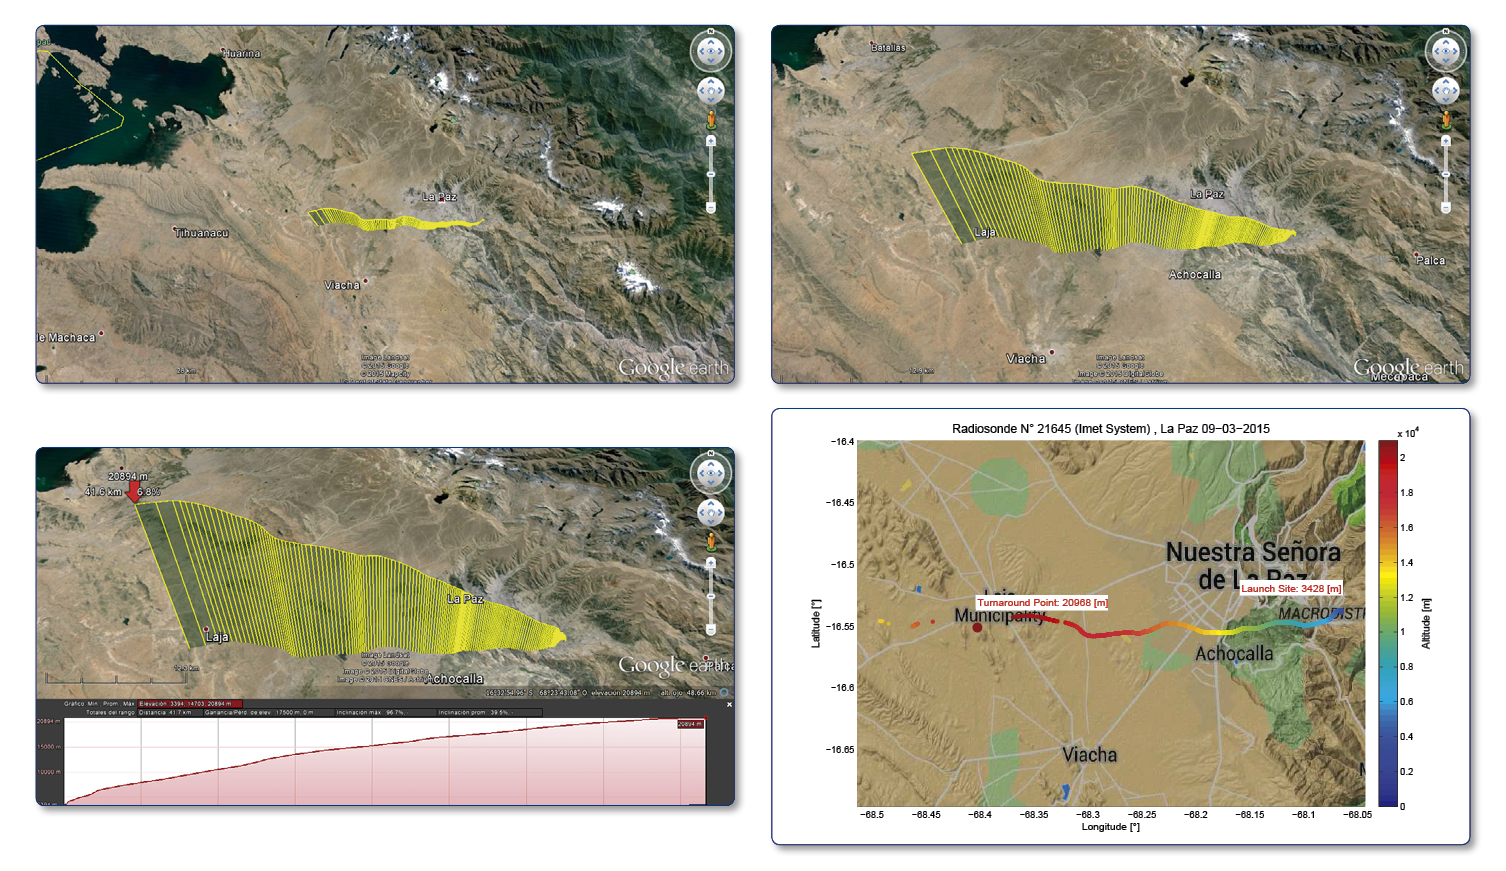
Balloon trajectory
As in previous launches, the radiosonde trajectory was westwards. The fourth graph shows that iMet system had problems in data reception near to maximum height point.
(Click on the figures to enlarge)
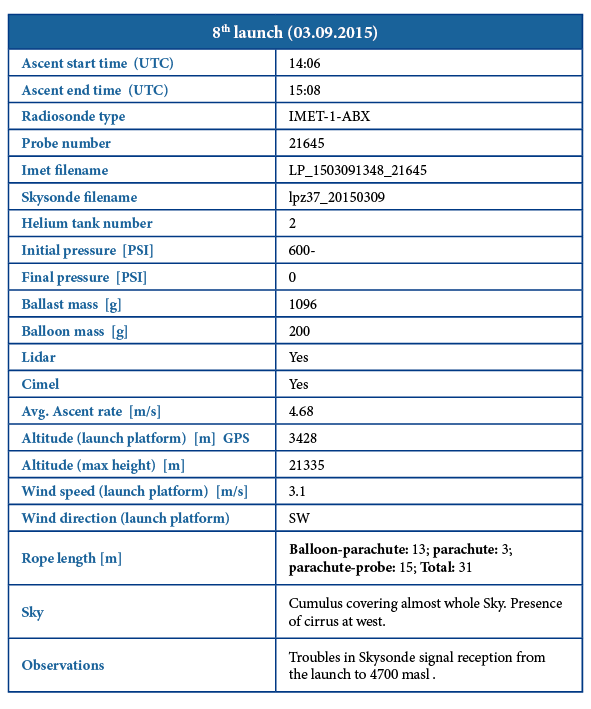
The principal parameters of launch preparation and flight are shown in the table below.
|